
Direct Answer
What is restaurant prime cost dashboard?
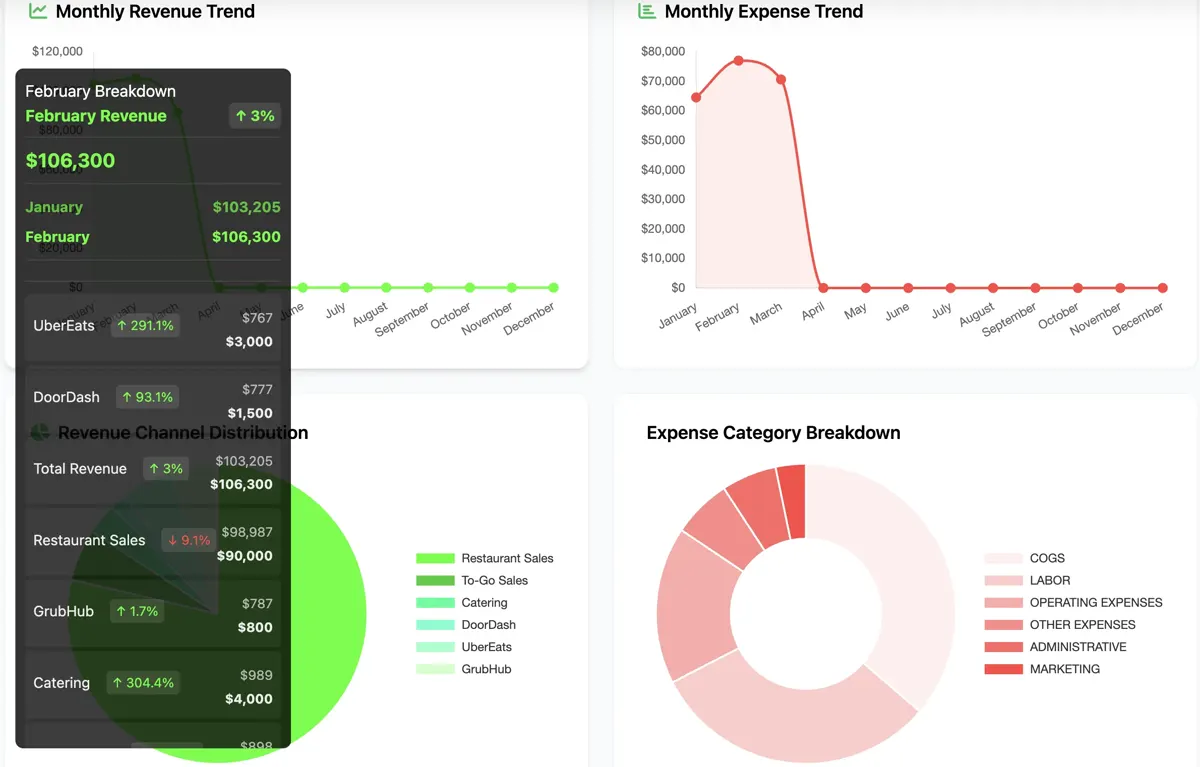
Restaurant prime cost is food cost plus beverage cost plus labor, usually shown as a percent of sales. MarginStack builds weekly prime cost dashboards that connect those inputs to targets, variance, and operator notes.
Search Intent
Built for the exact problem operators are searching for.
For operators searching for restaurant prime cost dashboard, food and labor cost reporting, prime cost software, or weekly margin control.
Food, beverage, and labor movement against sales
Target ranges for healthy and risky operating zones
Owner-ready explanations for what moved and why
Who this is for
- Restaurants trying to control food and labor at the same time
- Owners who need prime cost before month-end
- Small groups standardizing financial review by location
Common questions
What should a restaurant prime cost dashboard include?
It should show food cost, beverage cost, labor cost, sales, prime cost percentage, target ranges, trend movement, and the operating reasons behind changes.
Can MarginStack connect prime cost to weekly reporting?
Yes. We can build the dashboard around weekly sales, labor, purchase, inventory, or accounting inputs depending on what data is available.
Related systems
P&L Dashboards
Restaurant P&L Dashboard
AI-assisted restaurant P&L dashboards that turn sales, labor, food cost, controllables, and period movement into an operator-ready story.
Food Cost Dashboard
Restaurant Food Cost Dashboard
Restaurant food cost dashboards for COGS, purchases, inventory, recipes, waste, variance, vendors, and item-level margin control.
Labor Cost Dashboard
Restaurant Labor Cost Dashboard
Labor cost dashboard before payroll — in time to fix the week. Labor vs sales, scheduled vs actual, overtime risk. Owned dashboard, not another seat fee.