
Direct Answer
What is restaurant financial dashboard?
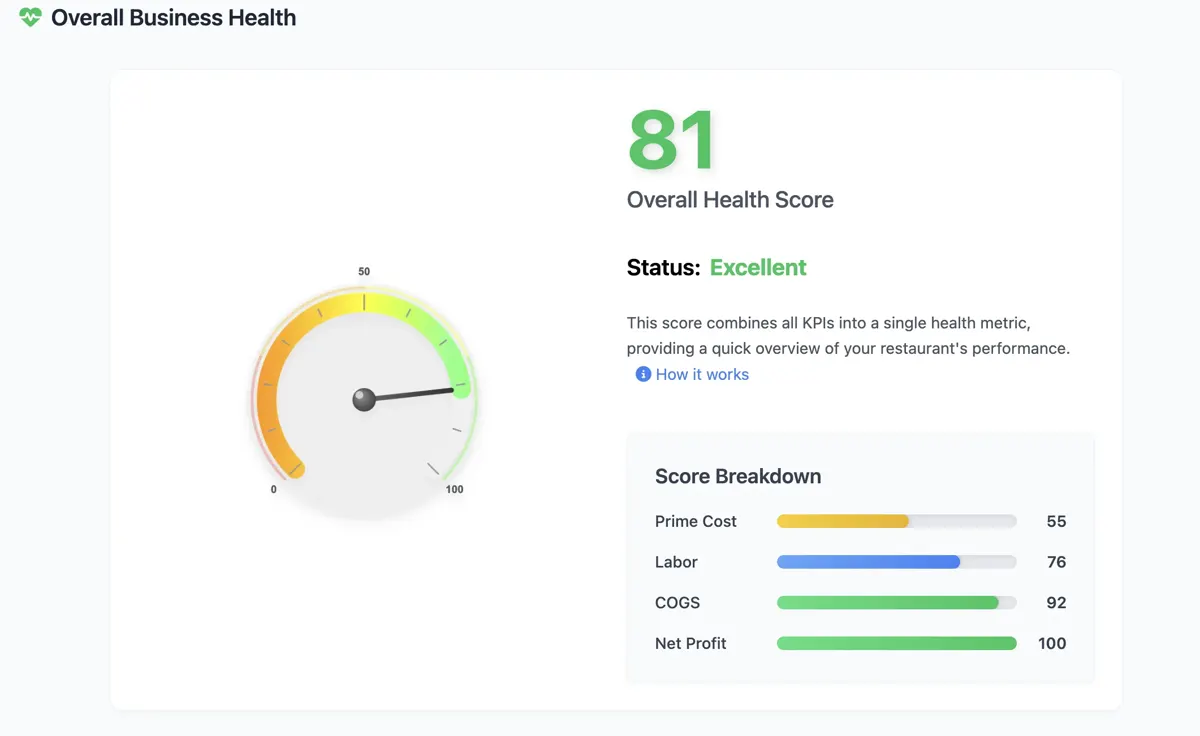
A restaurant financial dashboard combines revenue, expenses, P&L movement, prime cost, labor, COGS, and targets into an owner-ready view. MarginStack builds that reporting layer beside POS, payroll, and accounting — not as a replacement for the accountant.
Search Intent
Built for the exact problem operators are searching for.
For owners searching for restaurant financial dashboard, owner reporting, P&L dashboard, restaurant KPI dashboard, or financial visibility software.
P&L and KPI views by month, period, and location
AI-assisted summaries that explain financial movement
Cleaner reporting conversations between operators and finance
Who this is for
- Owners who need financial clarity without rebuilding reports
- Operators who want P&L visibility before month-end
- Small restaurant groups managing multiple locations
Common questions
What makes a restaurant financial dashboard useful?
It needs to connect the numbers to action: sales, expenses, labor, COGS, prime cost, margin, targets, and the reason performance moved.
Can MarginStack build this around my current reports?
Yes. We can start with existing accounting exports, spreadsheets, POS reports, labor files, or manually entered operating data.
Related systems
P&L Dashboards
Restaurant P&L Dashboard
AI-assisted restaurant P&L dashboards that turn sales, labor, food cost, controllables, and period movement into an operator-ready story.
Owner Reporting
Restaurant Owner Reporting
Restaurant owner reporting systems for weekly summaries, P&L movement, sales, labor, food cost, exceptions, targets, and next actions.
Dashboard Software
Restaurant Dashboard Software
Custom restaurant dashboard software for sales, labor, food cost, inventory, P&L, menu engineering, and owner visibility.